ArXiv data and paper recommender
This is a description of the process of putting together my arXiv math paper recommender.
The dataset
The arXiv is a repository of technical papers in quantitative sciences and mathematics maintained by Cornell University. It is common practice for an author to upload a version of their paper to the arXiv around the same time that submit their paper for publication in a journal.
While searching Kaggle for interesting datasets, I came across the arXiv metadata dataset, which is maintained by the arXiv. This dataset contains metadata on all arXiv papers (updated weekly). Since I have a background in academia, this seemed like a natural place to look for some interesting trends.
Making sense of the dataset
The data itself was in a ~3.5 gigabyte json file. That was a large enough file size that it had to be read into pandas block by block. To start, I loaded the first million rows into a pandas dataframe.
The first thing I wanted to do was to get a sense of the distribution of papers by subject. That required understanding the specific format of the data as well as how subjects are organized by the arXiv in general. It turns out that the metadata included in the file had the specific category-code tags associated to each paper, but not the proper category names, nor the general subjects. So if a paper was an algebraic geometry paper, it would have the 'math.AG' tag in the metadata, but not 'algebraic geometry' nor 'mathematics' (while this tag seems easy enough to read the subject from, not all tags are of this shape).
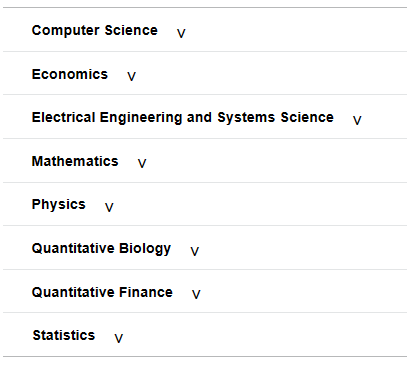
There are eight subjects covered by the arXiv [with the associated code in brackets]: computer science [cs], economics [econ], electrical engineering and systems science [eess], mathematics [math], physics, quantitative biology [q-bio], quantitative finance [q-fin], and statistics [stat] (physics lacks a code, as it is divided into many subsubjects). At first glance, there is a table of all topic categories on the ArXiv Category Taxonomy page. It contains 155 categories, split among 40 cs categories, 3 econ categories, 4 eess categories, 32 math categories, 51 physics categories within 13 sub-subjects, 10 q-bio categories, 9 q-fin categories, and 6 stat categories.
To even begin the task of tagging articles with the appropriate subjects, I needed to turn the information on the arXiv taxonomy page into a python dictionary. I needed to pull all the information from the 155 categories off the webpage. The taxonomy page is formatted as an accordion of tables.

I used the BeautifulSoup package for python to pull the data off of the website.
import requests
from bs4 import BeautifulSoup

#import arxiv categories page url into BeautifulSoup
url = "https://arxiv.org/category_taxonomy"
page = requests.get(url)
soup = BeautifulSoup(page.content,'html.parser')

#restrict to the categories table in the page
tax_list_tag = soup.find(id='category_taxonomy_list')

#get list whose elements contain each of the main subject categories
cat_tax_list = tax_list_tag.find_all(attrs={'class':'accordion-body'})
All the categories of a particular subject, except for physics, are in a table with two columns, the first being the arxiv category code code (with name in parethesis), and the second being a description.

I used BeautifulSoup to pull the data from each table and into a pandas dataframe and used pandas to move the category names into a separate column from the arXiv code.
import pandas as pd

#restrict to the computer science categories
comp_sci_tag_list = cat_tax_list[0].find_all(attrs={'class':"columns divided"})

#extract computer science categories into a list whose elements are dictionaries with the arxiv id, category name, and description
tagged_comp_sci_list = []
for entry in comp_sci_tag_list:
    row = {'arxiv_id':entry.find('h4').text,
        'category_name':entry.find('span').text,
        'description':entry.find("p").text}
    tagged_comp_sci_list.append(row)

#compile the computer science categories into a DataFrame.
comp_sci_categories = pd.DataFrame(tagged_comp_sci_list)

#strip extra formatting out of computer science categories
for index, row in comp_sci_categories.iterrows():
    comp_sci_categories['arxiv_id'][index] = row['arxiv_id'].replace(row['category_name'],"").strip()
    comp_sci_categories['category_name'][index] = row['category_name'].strip('()')
The physics section is a table with three columns, one for the primary category, one with the sub-category, and one with a description.

Again I used BeautifulSoup to extract a dataframe, but now with both primary category and sub-category information.
#restrict to the physics categories
phys_sup_tag_list = cat_tax_list[4].find_all(attrs={'class':"physics columns"})

#extract physics categories into a list whose elements are dictionaries with the arxiv id, category name, and description
tagged_phys_list = []
for cat in phys_sup_tag_list:
    phys_tag_list = cat.find_all(attrs={'class':"columns divided"})
    for entry in phys_tag_list:
        row = {'super_category_name':cat.find('h3').text,
            'super_category_id':cat.find('span').text,
            'arxiv_id':entry.find('h4').text,
            'category_name':entry.find('span').text,
            'description':entry.find("p").text}
        tagged_phys_list.append(row)

#compile the physics categories into a DataFrame.
phys_categories = pd.DataFrame(tagged_phys_list)

#strip extra formatting out of physics categories
for index, row in phys_categories.iterrows():
    phys_categories['arxiv_id'][index] = row['arxiv_id'].replace(row['category_name'],"").strip()
    phys_categories['category_name'][index] = row['category_name'].strip('()')
    phys_categories['super_category_name'][index] = row['super_category_name'].replace(row['super_category_id'],"").strip()
    phys_categories['super_category_id'][index] = row['super_category_id'].strip('()')
Data cleanup
Once these dataframes were neatly put together, I could start to add subject information to the arXiv metadata. I read off the first million entries of the json file into a dataframe and wrote a script to add a column with the subjects based on the category tags. There were a few complications. First, there are often multiple category codes for a given article, so each code needs to be read out of a string and handled separately. Second, different category codes correspond to a single subject (for example, the astrophysics of galaxies category and the nuclear experiment category are both physics). Third, there are 6 equivalent categories in different subjects (mathematical physics is both a math and a physics category with a math code of math.MP and a physics code of math-ph). Fourth, there are 20 depreciated category tags not listed on the arXiv taxonomy page at all.
For the first problem, I wrote a script turning the comma-separated string of category codes into a list.
When writing the code to generate the subject information for each paper, the second problem was dealt with by storing the subjects in a python set. Each category code in the list generated in the step above would be converted to the corresponding subject by the dictionaries produced earlier. By storing the results in a set, only a single copy of the distinct subjects would remain.
#Turn list of arxiv_id category codes to set of subjects
def ParsedCatToSubject(catlist):
    SubjectList = [IdToSubject(cat) for cat in catlist]
    SubjectSet = set(SubjectList)
    return SubjectSet

#Output general subject given a category arxiv_id
def IdToSubject(a_id):
    if a_id in comp_sci_categories.arxiv_id.unique():
        return "Computer Science"
    elif a_id in econ_categories.arxiv_id.unique():
        return "Economics"
    elif a_id in eess_categories.arxiv_id.unique():
        return "Electrical Engineering and Systems Science"
    elif a_id in math_categories.arxiv_id.unique():
        return "Mathematics"
    elif a_id in phys_categories.arxiv_id.unique():
        return "Physics"
    elif a_id in phys_categories.super_category_id.unique():
        return "Physics"
    elif a_id in qbio_categories.arxiv_id.unique():
        return "Quantitative Biology"
    elif a_id in qfin_categories.arxiv_id.unique():
        return "Quantitative Finance"
    elif a_id in stat_categories.arxiv_id.unique():
        return "Statistics"
    elif a_id in extra_category_to_subject.keys():
        return extra_category_to_subject[a_id]
    else:
        return "unknown"
Since some papers would only be tagged with one of the equivalent category codes, the third problem was solved by checking each paper for either entry in all of the category code pairs, appending the missing code if only one was present. This was also a good opportunity to add in the updated versions of any depreciated category codes each paper may have been tagged with.
#Turn string of arxiv_id categories into a list of arxiv_id category codes together with aliases
def ParseCategories(stringlist):
catlist = stringlist.split()
for key, value in CATEGORY_ALIASES.items():
    if (key in catlist) and (not value in catlist):
        catlist.append(value)
    elif (value in catlist) and (not key in catlist):
        catlist.append(key)
for key, value in EXTRA_ALIASES.items():
    if (key in catlist) and (not value in catlist):
        catlist.append(value)
        #catlist.remove(key)
return catlist
The fourth problem was the most unanticipated. After having a script that took into acount the three other issues, there were many papers that were still failing to get classified. I added in a new classification "unknown" for any category tag which did not get classified by the existing script. Then I would run the classification script, subset the dataframe to those papers with an 'unknown' subject, and look at the first paper. From there I could find an offending category code and go onto the paper's arXiv webpage to see what modern category code the old code had been replaced by. Each time I found a new code, I added it to a dictionary of depreciated codes and their updated versions for future reference, as well as a dictionary with the current subject. After each update, I reran the script and the collection of 'unknown' papers got smaller, until eventually I had found all 20 codes and there were no remaining 'unknown' subjects.
EXTRA_ALIASES = {
    'adap-org':'nlin.AO',
    'solve-int':'nlin.SI',
    'solv-int':'nlin.SI',
    'alg-geom':'math.AG',
    'chao-dyn':'nlin.CD',
    'funct-an':'math.FA',
    'dg-ga':'math.DG',
    'q-alg':'math.QA',
    'adap-org':'nlin.AO',
    'atom-ph':'physics.atom-ph',
    'chao-dyn':'nlin.CD',
    'chem-ph':'physics.chem-ph',
    'patt-sol':'nlin.PS',
    'comp-gas':'nlin.CG',
    'acc-phys':'physics.acc-ph',
    'ao-sci':'physics.ao-ph',
    'plasm-ph':'physics.plasm-ph',
    'mtrl-th':'cond-mat.mtrl-sci',
    'cmp-lg':'cs.CL',
    'supr-con':'cond-mat.supr-con'
}
Exploratory analysis
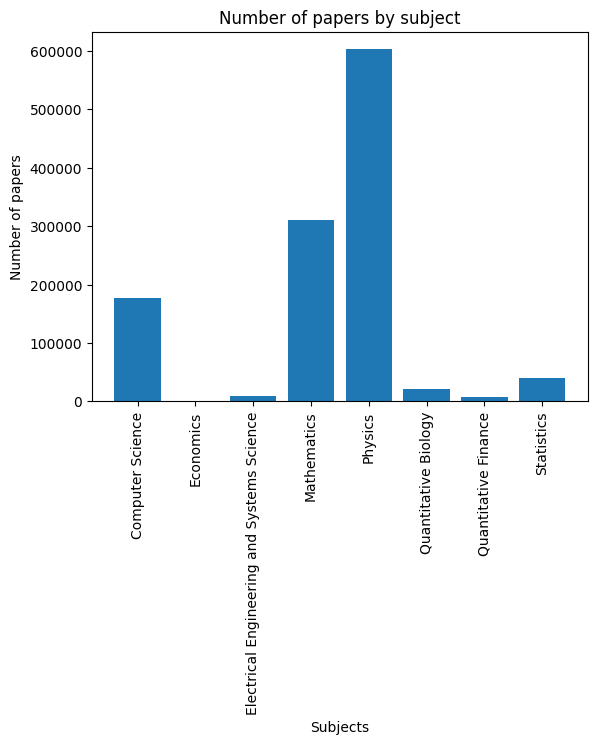
Having dealt with those issues, I tagged each of the papers with their relevant subjects. Using matplotlib, I was able to plot the following distribution.

It was clear that physics was the most popular subject, with more than half of the papers. Econ, not so much; note that there were 1043 econ papers, not 0 like one might assume by looking at the graph.
Mathematics papers
I decided that I wanted to restrict the dataset to mathematics papers. This was a part of the data I am inherently more familiar with. It also a large decrease in the amount of data to wrangle.
I produced a dataframe math_metadata by reading in the json file 10000 rows at a time and extracting those papers with math ids as dataframes to be concatinated together. I made sure to have all of the features correctly identified by datatype to reduce the filesize.
dtype_dict = {
    'id': 'string',
    'submitter': 'string',
    'authors':'string',
    'title':'string',
    'comments':'string',
    'journal-ref':'string',
    'doi':'string',
    'report-no':'string',
    'categories':'string',
    'license':'string',
    'abstract':'string',
    'versions':'object',
    'update_date':'datetime',
    'authors_parsed':'object'
}

math_metadata = pd.DataFrame()

with open('arxiv-metadata-oai-snapshot.json') as json_file:
    chunks = pd.read_json('arxiv-metadata-oai-snapshot.json',dtype=dtype_dict,lines=True,chunksize=10000)
    for chunk in chunks:
        chunk['categories_parsed'] = chunk['categories'].map(ParseCategories)
        chunk['subjects'] = chunk['categories_parsed'].map(ParsedCatToSubject)
        math_chunk = chunk[chunk['subjects'].map(lambda x: 'Mathematics' in x)]
        math_chunk['update_date'] = pd.to_datetime(math_chunk['update_date'],infer_datetime_format=True)
        math_metadata = pd.concat([math_metadata,math_chunk])
With a basic dataframe together, I used the present features to explicitly add features for the creation date, numer of versions, and number of authors. I also ran the previously made functions to add the categorty names to each paper (while every paper was tagged as mathematics, some were also tagged as other categories, e.g. physics). More interesting, I added in the mathematical subjects from their arxiv codes (e.g. 'math.AG' became 'Algebraic Geometry').
#Process the math_metadata dataframe to produce useful features.

#Extract creation date of first version, put into Datetime format
math_metadata['creation_date'] = pd.to_datetime(math_metadata['versions'].map(lambda x: x[0]['created']))

#Extract total number of versions
math_metadata['version_number'] = math_metadata['versions'].map(lambda x: len(x)).astype(int)

#Extract total number of authors
math_metadata['author_number'] = math_metadata['authors_parsed'].map(lambda x: len(x)).astype(int)

#Parse categories field into a list of categories
math_metadata['categories_parsed'] = math_metadata['categories'].map(ParseCategories)

#Take the parsed categories and deduce the subjects releveant for each paper
math_metadata['subjects'] = math_metadata'categories_parsed'].map(ParsedCatToSubject)

#Add column of mathematical subjects from the list of arxiv_id category codes
math_metadata['math_subjects'] = math_metadata['categories_parsed'].map(CategoryToSubjectSet)
Running all of this from the arxiv json file takes a while to run, so I saved the resulting dataframe for future use as a pickel file.
#Save math arxiv dataframe
math_metadata.to_pickle('math_metadata.pkl')